A deep dive into Pino
What is it, how does it work for logging and why you should use it

Logging in Node.js development is important because it helps developers monitor the events of their application, track performance, and get alerted of bugs or system malfunctions in their apps.
Logging also comes in handy in production environments for quickly detecting and fixing the source of errors. Moreover, logging offers developers enhanced visibility by providing a clear view of an application’s behavior and performance.
Side Effects of Logging
Logging is a side effect of your functions.
When using logging in a function in your application, what happens when the function is called multiple times?
You might lose logs if your application crashes while calling the function. Alternatively, you may find yourself in a dilemma, deciding between whether or not your application should fail if it cannot log. You may also find yourself having to decide whether to prioritize serving your users or focus on the information in your logs. This presents an important engineering decision.
Logging can also cause an “Out of Memory” error when the logging rate exceeds what the CPU can handle, meaning that theCPU receives more requests than it can handle per given period, leading to the RAM getting filled up.
Pino - A Better Alternative
Pino is a very low-overhead Node.js Logger, first published in 2014. Since then, it has gained popularity due to its speed, efficiency, and flexible configuration.
Pino has first-class support for other web frameworks like Express, Fastify, Nest, Restify, Hapi, Koa, and core Node, and is the default logger for Fastify.
Why do developers choose Pino?
First of all, Pino runs asynchronously; meaning it accumulates the logs if the destination is busy and sends them immediately when the destination becomes available.
Secondly, Pino is about five times faster than most other alternatives. To gain this speed, Pino utilizes minimal resources for logging, and as a result, log messages tend to get added over time, leading to a throttling effect on the application, like reduced requests per second.
Additionally, Pino is not a stand-alone tool as it supports being bundled with tools such as Webpack and esbuild, providing developers with more integrational options and subsequently, opportunities for creativity.
Getting started with Pino
To start using Pino, run the command below to install the package:
npm install pino
Install the log formatter, pino-pretty, to provide more readable logs, using the command below:
npm install pino-pretty
Pino Features
JSON logging and prettifying of JSON logs
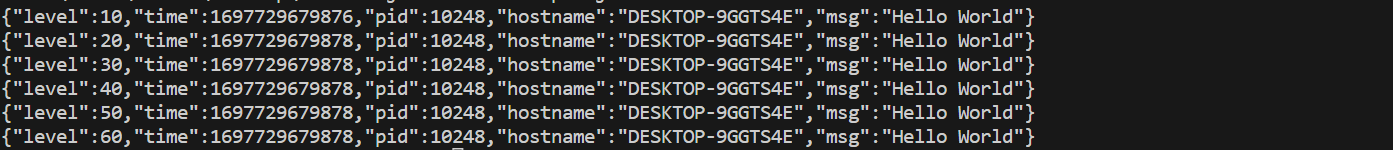
Pino’s default output is formatted and structured in JSON, the industry standard for logging. The following fields are present in the log’s entry:
level - Indicates the severity of the event being logged.
time - Indicates the time the event was logged. The default time is logged in milliseconds (time lapsed since January 1, 1970, 00:00:00 UTC)
pid - Indicates the process ID of the Node program being executed
hostname - Indicates the hostname of the machine the program is running
msg - Indicates the message specified for that particular log.
Here is an example of what a log created by Pino looks like.

While JSON is the standard for Production, inline JSON can be difficult to read, making it less than ideal outside of development mode. This is where the Pino Pretty package comes in handy, converting single-line JSON logs to more human-readable texts.
To format the JSON logs using pino-pretty, you can use either of the following two methods:
1. Using the terminal
With the command below, you can run the pino-pretty package while executing your index file in the terminal:
node index | npx pino-pretty
2. Using the package directly in your code
You can implement the Pino-Pretty package in your code. First, you have to install the package by running the command below.
npm install pino-pretty
Then, implement the package in your code, as shown below:
const pino = require("pino");
const logger = pino({
  transport: {
    target: "pino-pretty",
  },
});

logger.info(`Hello World`);
The output in the terminal is now reformatted and coloured to be more readable.

Log Levels, their customization, and default fields
There are six default log levels in Pino, and they are (arranged in ascending order of severity):
trace - indicated by a level number of 10
debug - indicated by a level number of 20
info - indicated by a level number of 30
warn - indicated by a level number of 40
error - indicated by a level number of 50
fatal - indicated by a level number of 60
const pino = require("pino");
const logger = pino()

logger.trace(“Hello World”);
logger.debug(“Hello World”);
logger.info(“Hello World”);
logger.warn(“Hello World”);
logger.error(“Hello World”);
logger.fatal(“Hello World”);
When you run the above code, this is the output you will obtain:

You will notice that there is no log emitted for the debug() and the trace() methods because the default minimum level on a Pino logger is the info() method, which causes less severe events to be suppressed.
However, you can set the minimum log level when creating the logger as follows:
const pino = require("pino");
const logger = pino({
  level: "trace",
});
You can also set the minimum log level by instantiating the level property on the logger to the class you want.
const pino = require("pino");
const logger = pino();
logger.level = "trace"
When you rerun the code above, you will get the following output:
You can also add custom levels to the list of log levels using the code snippet below.
const pino = require("pino");
const logger = pino({
  level: "trace",
  customLevels: {
    signal: 25  //Any number set between 20 (debug) and 30 (info) will work the same
  }
});
logger.signal("Hello World")
Adding Context to Errors And Log Messages
Adding contextual meaning to your messages in your logs provides additional details to the logged event, helping you trace errors faster and fix bugs more efficiently, ultimately saving time during development.
In addition, adding context also helps in production when monitoring your application and when debugging and troubleshooting.
For example, in a web application, adding contextual information such as error status, and the user ID making the request can help quickly identify the issue's cause.
In Pino, the main way to add contextual data to your logs is through the mergingObject parameter on a level method.
const pino = require("pino");
const logger = pino();

logger.error({
    statusCode: 500,
    message: "An internal server error occurred because the request sent a wrong data type",
    userID: "2345fjgnsd-4567",
})
The above snippet produces the following output in the console.

You can add as many key-value pairs as you wish to add more context to the log.
Transporting your Logs
Pino transports can be used to transmit and transform your log outputs. Pino generates logs to minimize the effect of logging on your application and provides flexibility in how logs are processed and stored.
Pino prints logs to the standard output by default. However, you can also configure it to log to a file or other remote destinations like a remote log management service.
Here is a code snippet that shows how to use the built-in pino/file transport to send your logs to a file.
const pino = require("pino");
const fileTransport = pino.transport({
    target: "pino/file",
    options: {
        destination: `${__dirname}/app.log`
    }
})
const logger = pino(fileTransport);

logger.info("Hello World");
When you run your code in the terminal, you an app.log file is created automatically (if one did not already exist), and your logs will be added to the file.
Alternatively, you can use the pino.destination() API like this, as shown below.
const pino = require("pino");
const stream = pino.destination({
    dest: `${__dirname}/app.log`
})
const logger = pino(stream);

logger.info("Hello World");
It is important to note that pino/file uses pino.destination() under the hood. However, what differentiates them is that the latter runs in the main thread while the former runs in a worker thread.
It is better to stick to the pino.destination() when logging to standard output or local files, as pino/file may add overhead due to the data needing to first be transferred from the main thread.
The pino/file is only recommended when logging to multiple destinations, like a third-party log management service, and to a local file simultaneously.
Redaction in Pino
It is extremely important to keep sensitive information out of your logs. Examples of such sensitive data include financial data such as card numbers, bank accounts, and transaction pins.
Other examples include passwords or application secret keys, medical records, and any information that can be used to identify a person, such as Government and tax IDs.
Including sensitive information in your logs can lead to malicious activities, which can damage trust in your application, data breaches, and can even attract fines and penalties from regulatory bodies.
This is where the Pino redact feature comes in handy, helping you keep sensitive data out of your logs. Take the following example:
const pino = require("pino");
const logger = pino({
  redact: {
    paths: [
      "user.firstName",
      "user.lastName",
      "user.address",
      "user.email",
      "user.password",
      "user.userName"
    ],
    censor: ["PINO REDACTED"], //Default is Redacted
  },
});

const user = {
  id: "5f8b556cb27a1a38595d7b8e",
  userName: "john_doe",
  firstName: "John",
  lastName: "Doe",
  email: "johndoe@gmail.com",
  password: "7c4a8d09ca3762af61e59520943dc26494f8941b",
  address: {
    street: "123 Elm Street",
    city: "Springfield",
    country: "United States",
  },
};

logger.info({ user }, "User Updated");
The above snippet will log the response below to the console.

You can also specify the remove option in the redact class to true to reduce the verbosity of your logs so they don’t take up too much space.
By doing so, you will get the below output in your console.

Advantages of Pino over Other Logging Libraries
Asynchronous Logging
Pino supports asynchronous logging by leveraging Nodejs' asynchronous capabilities. Non-blocking I/O operations and the event-driven architecture of Node.js are the main methods it uses to achieve asynchronous logging. This feature also enables the minimum overhead of Pino.
Pino is designed to reduce blocking I/O operations. This means that when you log a message using Pino, it writes the log to either a console or file output asynchronously. It does not block the execution thread or interrupt your application.
It also supports writeable streams, allowing you to write to multiple destinations asynchronously. You can send log data streams to writeable interfaces such as files, network sockets, and other devices. These streams can be set to non-blocking mode, ensuring log data is written without blocking the main thread.
Furthermore, Pino gives you the ability to run your logs synchronously. However, by utilizing Pino's asynchronous logging, you can log your data without affecting your application's speed.
Gain Control Over Your Log Messages
Pino offers configuration choices, serializers, and modifications that give you control over your log messages. In turn, it helps you decide whether or not to keep your logs in case your application crashes.
Pino helps you specify the log level of each message, allowing you to control the verbosity of your logs. It also allows you to add custom log levels, which enables you to categorize your log messages according to your application needs.
Pino allows you to structure your application log messages in a way that suits your application requirements. By default, the log messages include various fields, such as timestamps and log levels. You will also be able to add custom data to provide context and insights into your logs.
Pino also lets you redact sensitive information in log messages, ensuring that confidential data is not included in your application logs.
In addition, Pino supports child loggers, allowing you to create loggers that take on the settings and serializers of a parent logger. This can be very helpful when dealing with modular applications or libraries.
Speed
Pino is popular for its exceptional speed and efficiency compared to many other logging libraries like Winston, Bunyan, Bole, Debug and others in the Nodejs ecosystem.
These images from the Pino documentation show the averages of other logging libraries in comparison with the Pino logging library across different benchmarks.
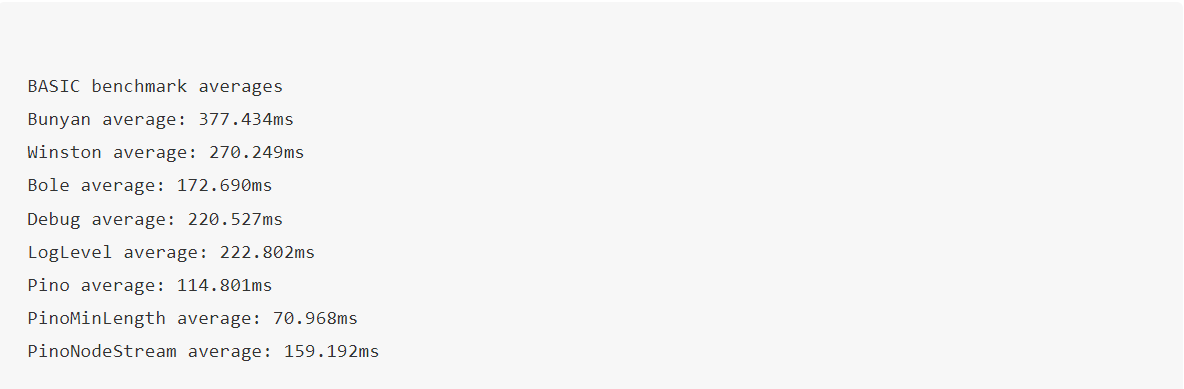
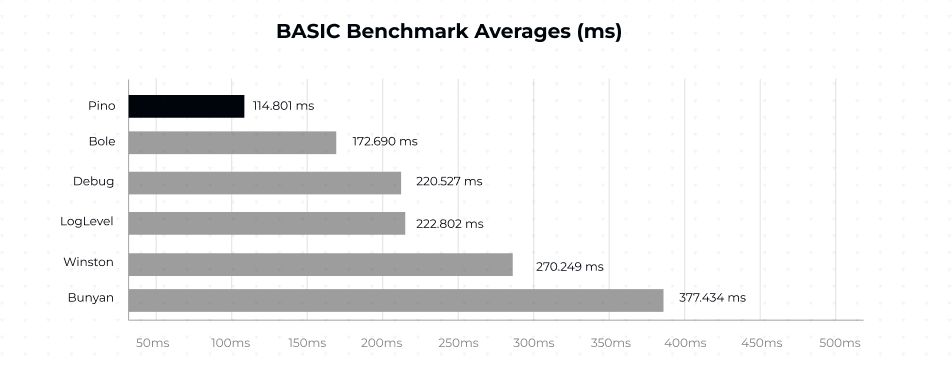
This shows the comparison using the BASIC benchmark for logging strings or characters across other logging libraries and the pino.info(‘hello world).
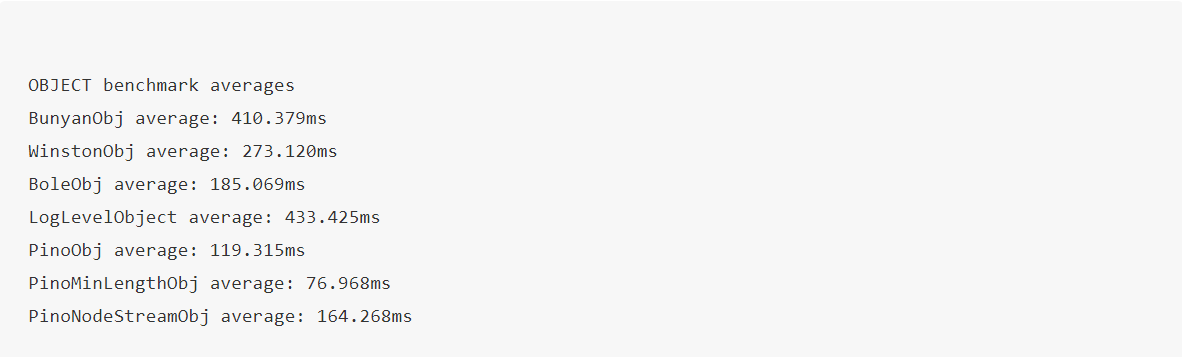
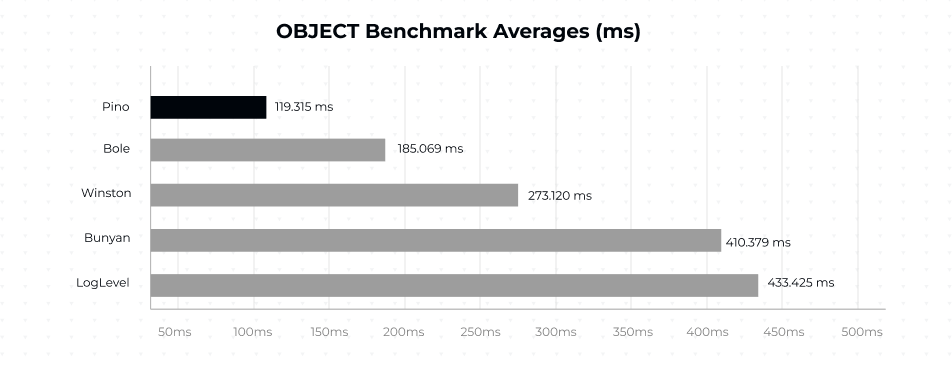
This image shows the speed comparison when logging objects.
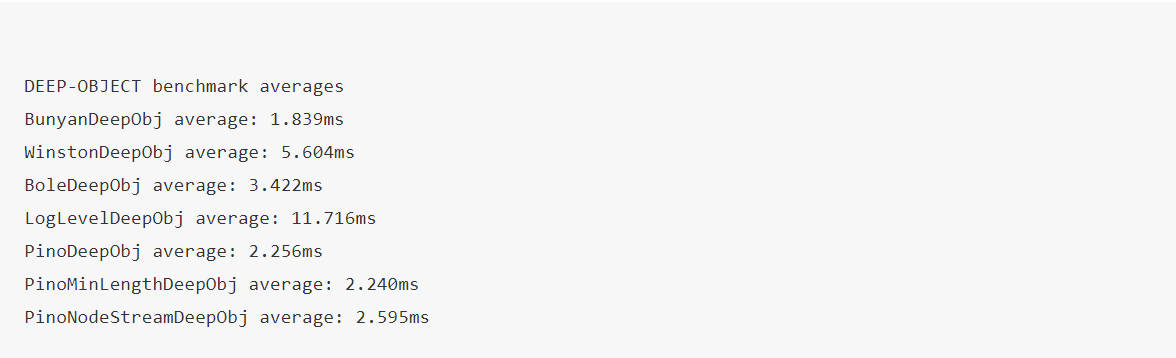
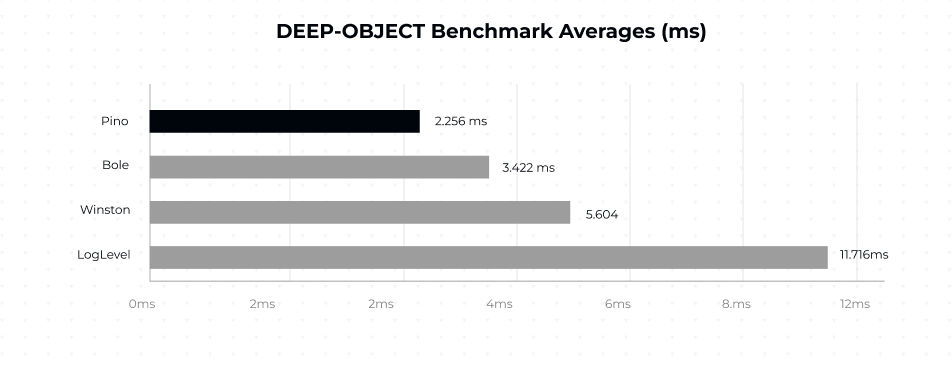
This image shows the average speed comparisons when logging Deep Objects.
These comparisons were done with Pino’s log level extended to include a timestamp and the Bole’s fastTime mode switched on.
This speed is attributed to some factors, which include low overhead, asynchronous design, fast serialization, and performance tuning.
Pino is designed to use as little CPU processing power and memory as possible. It focuses on doing just what's necessary for logging without adding unnecessary complexities. This means there is less computational load, resulting in increased speed.
Pino's serialization method, which transforms log data into a string for output, is designed for speed. It uses a quick JSON serializer and efficient data structures to reduce the time required for serialization.
How to Log with Platformatic and Pino
Platformatic uses Pino by default to output structured log messages, which is one of the main contributing factors to Platformatic’s speed.
All log messages are set to the “info” log level by default. However, this can be changed and set to your desired level. To do so, add a logger object to the server configuration group in the platformatic.db.json file.
{
  "server": {
    ........,
    "logger": {
      "level": "warn"
    }
  }
}
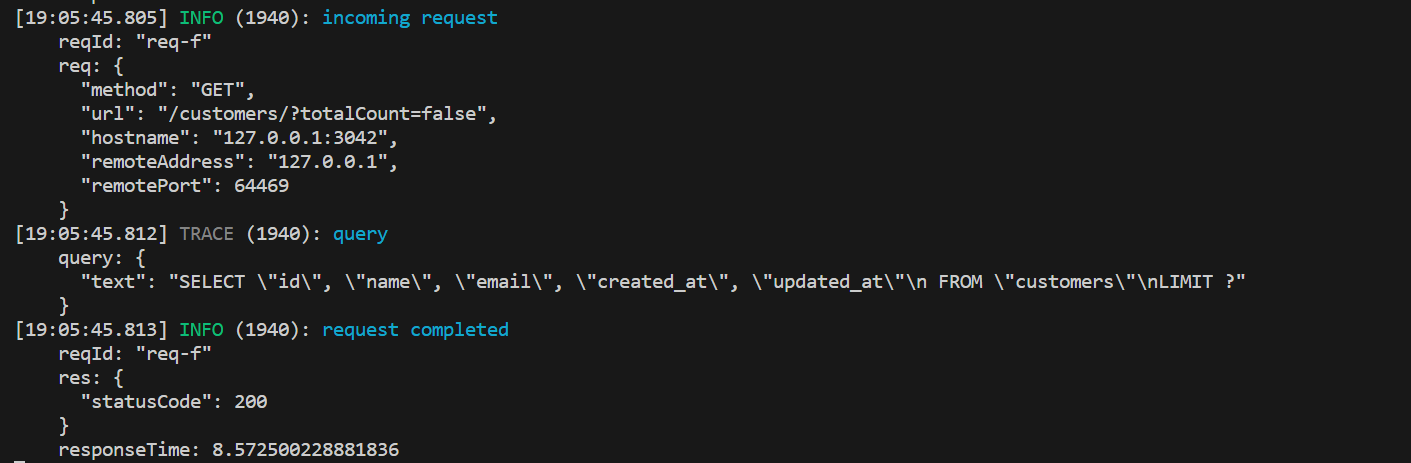
To get a more encompassing log, you can enable query logging to get all the queries sent to your database using Pino. To do so, simply set the log level to “trace.”
How To Log To Elastic Search
Platformatic allows you to log into ElasticSearch and also visualize your logs using Kibana. You can also send your logs using other transports.
In this section, we will see how to set up a Platformatic application to send logs to Elastic Search. Then we will visualize the logs using Kibana.
Create your docker-compose.yml file and paste the following commands into it.
---
version: '3.8'
services:
  elasticsearch:
    image: docker.elastic.co/elasticsearch/elasticsearch:8.3.3
    environment:
      - discovery.type=single-node
      # Elasticsearch 8.x has HTTPS and auth on by default. This option is
      # needed to use HTTP and no auth (as used in the tests).
      - xpack.security.enabled=false
    container_name: elasticsearch
    ports: ['9200:9200']

  kibana:
    image: docker.elastic.co/kibana/kibana:8.3.3
    container_name: kibana
    ports: ['5601:5601']
    depends_on: ['elasticsearch']
Next, get the Elastic Search and Kibana containers using the command below.
docker-compose -f docker-compose.yml up
Next, install the pino-elasticsearch transport package.
npm i pino-elasticsearch
Then, edit your platformatic.db.json configuration to set the pino-elasticSearch transport as the target. This setup logs to both the Kibana and your terminal.
{
..............,
"logger": {
      "level": "{PLT_SERVER_LOGGER_LEVEL}",
      "transport": {
        "targets": [{
          "target": "pino-elasticsearch",
          "options": {
            "node": "http://127.0.0.1:9200"
          }
        },
          {
          "target": "pino-pretty"
        }]
      }
    }
}
You can go on to start your server using the npm start command.
The last step is to configure Kibana.
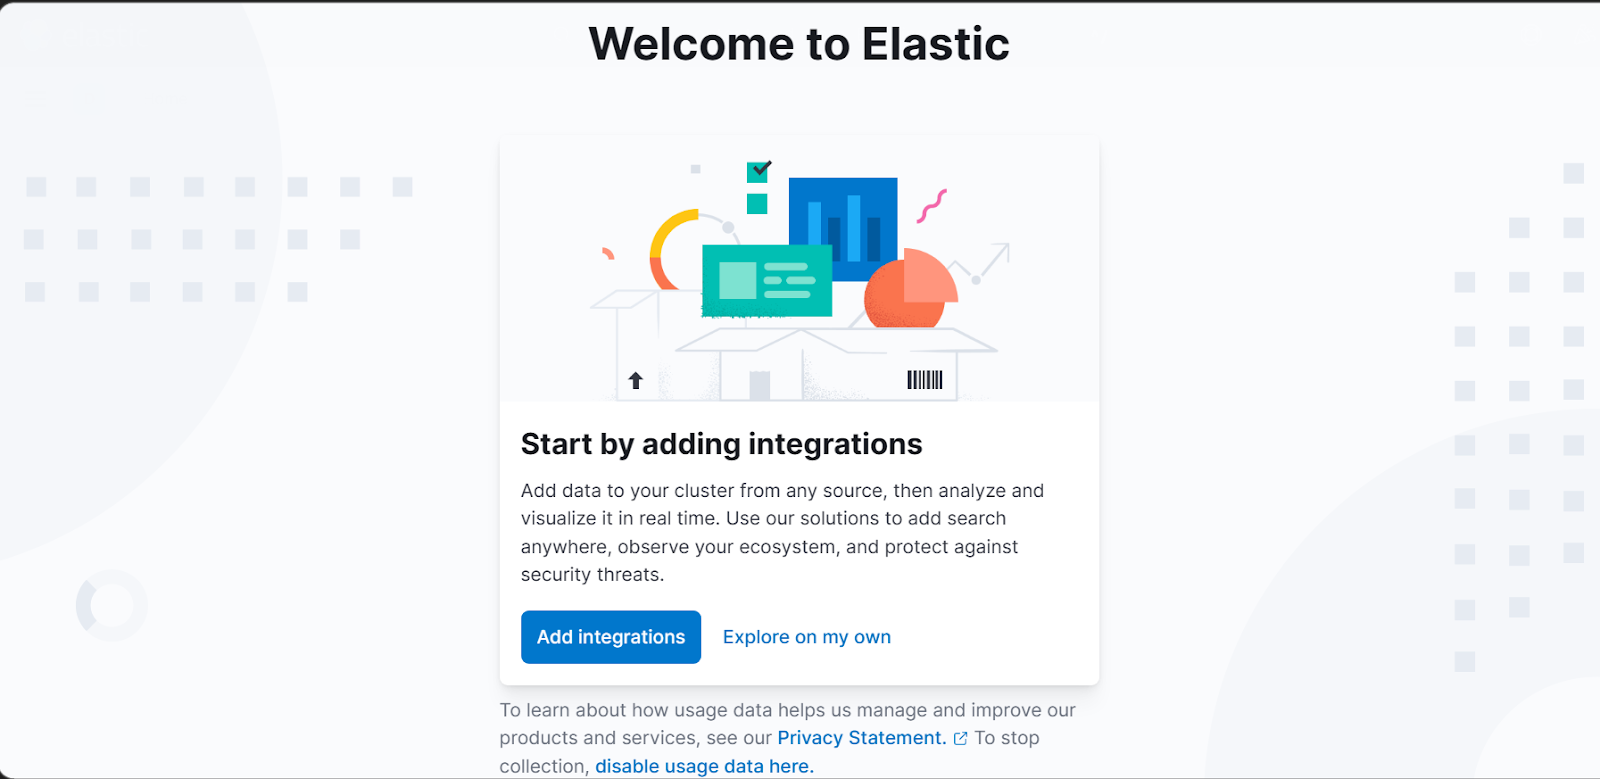
1. Open http://localhost:5601 in your browser
2. If you are using Kibana for the first time, click on the "Add integrations" or "Explore on my own button".
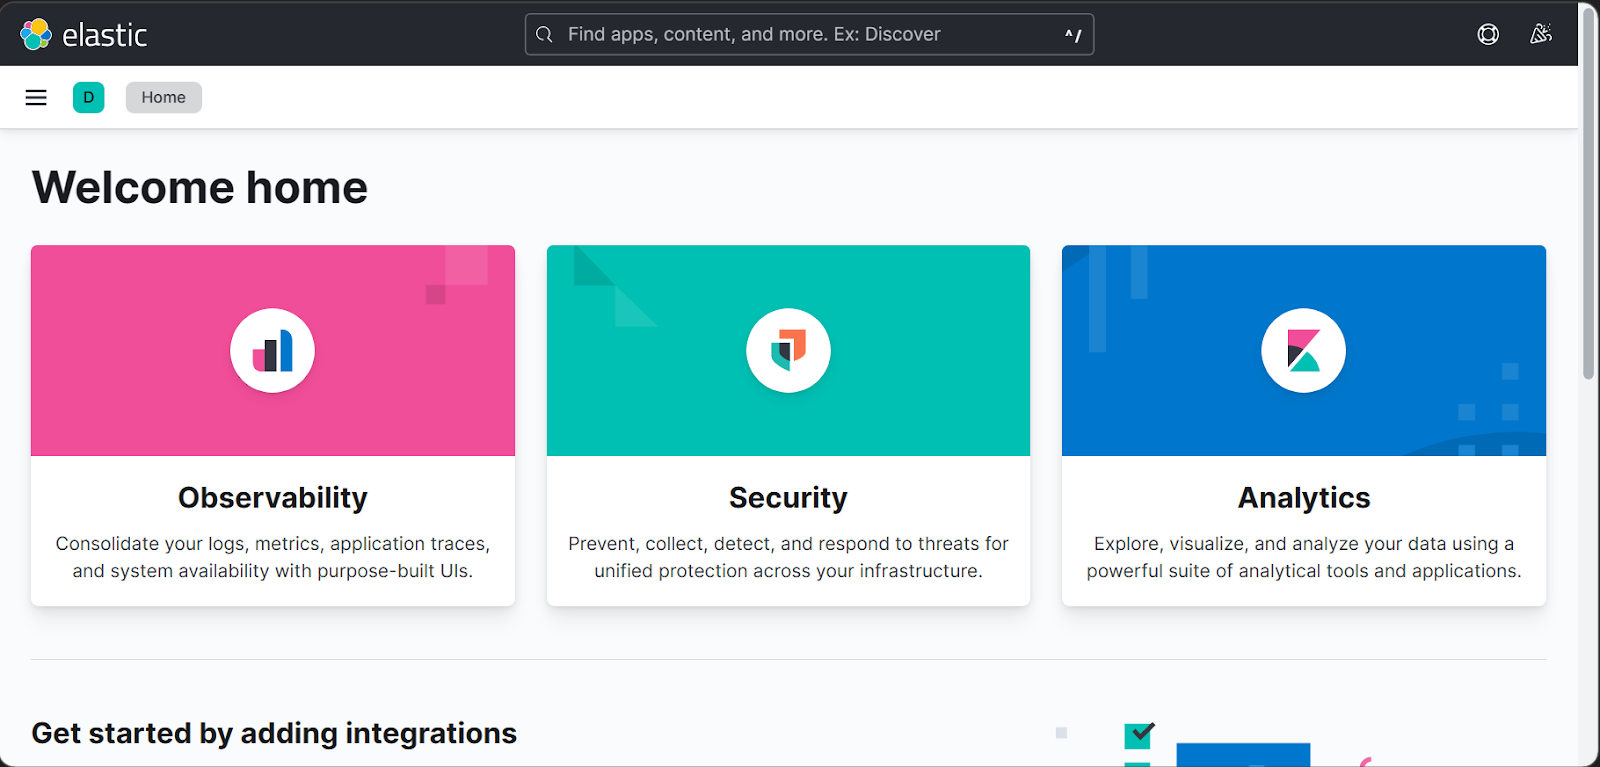
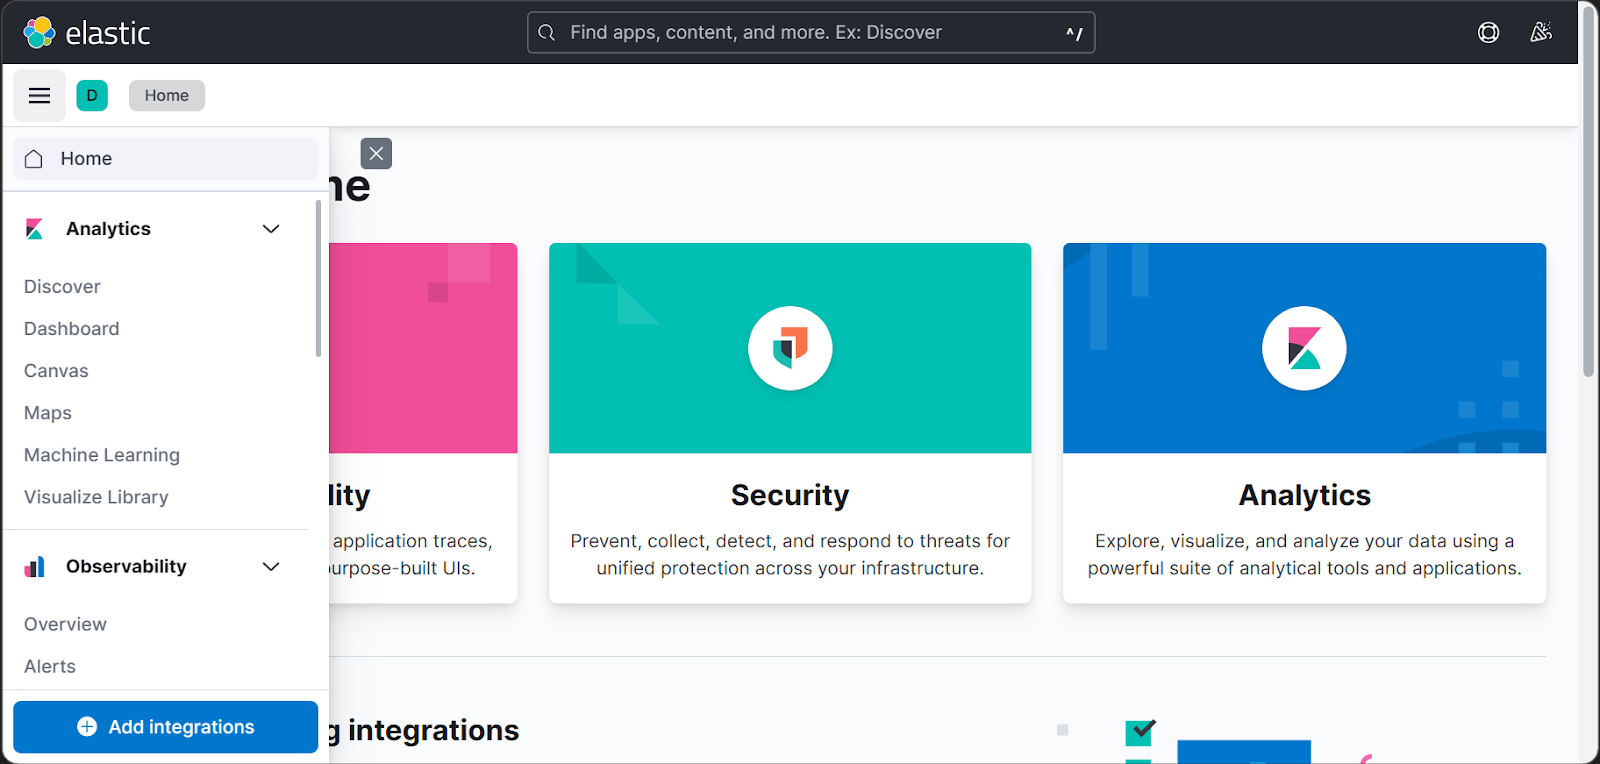
3. Then Click on the Hamburger on the top left corner of the page and click on the Discover tab.
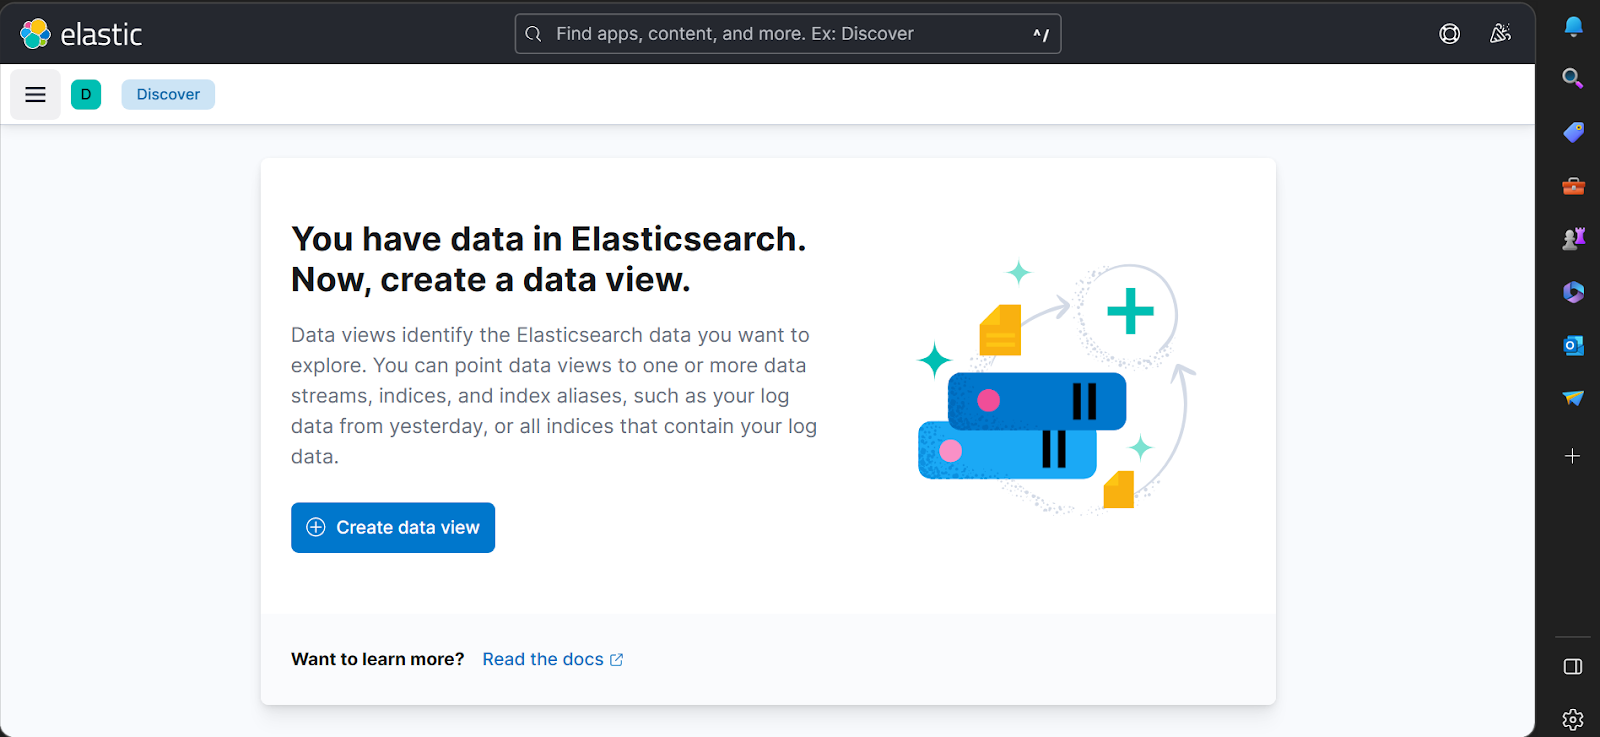
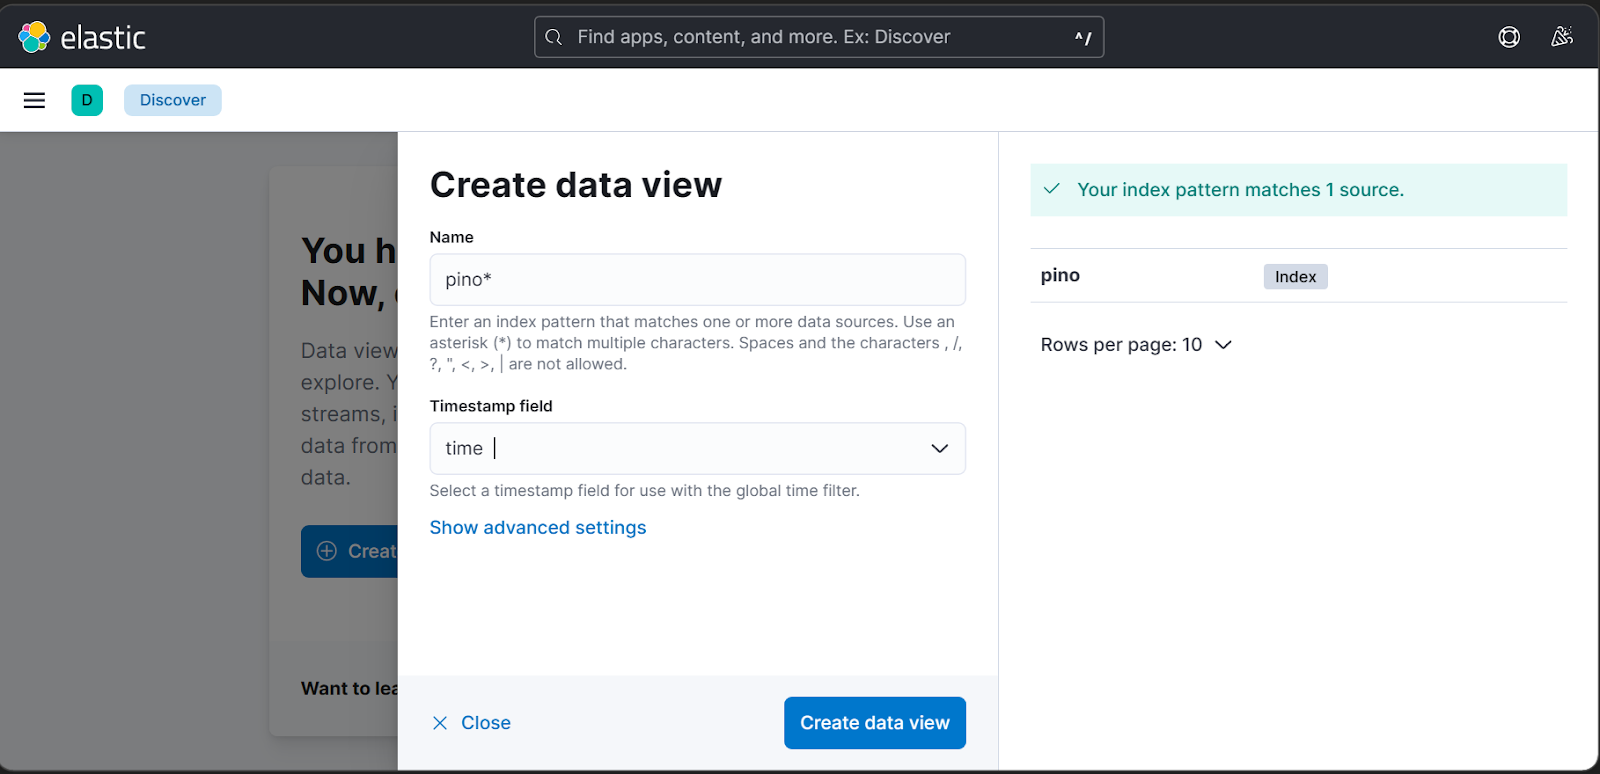
4. Click on the Create Data View button
5. Input pino* in the name field and select time in the timestamp field options.
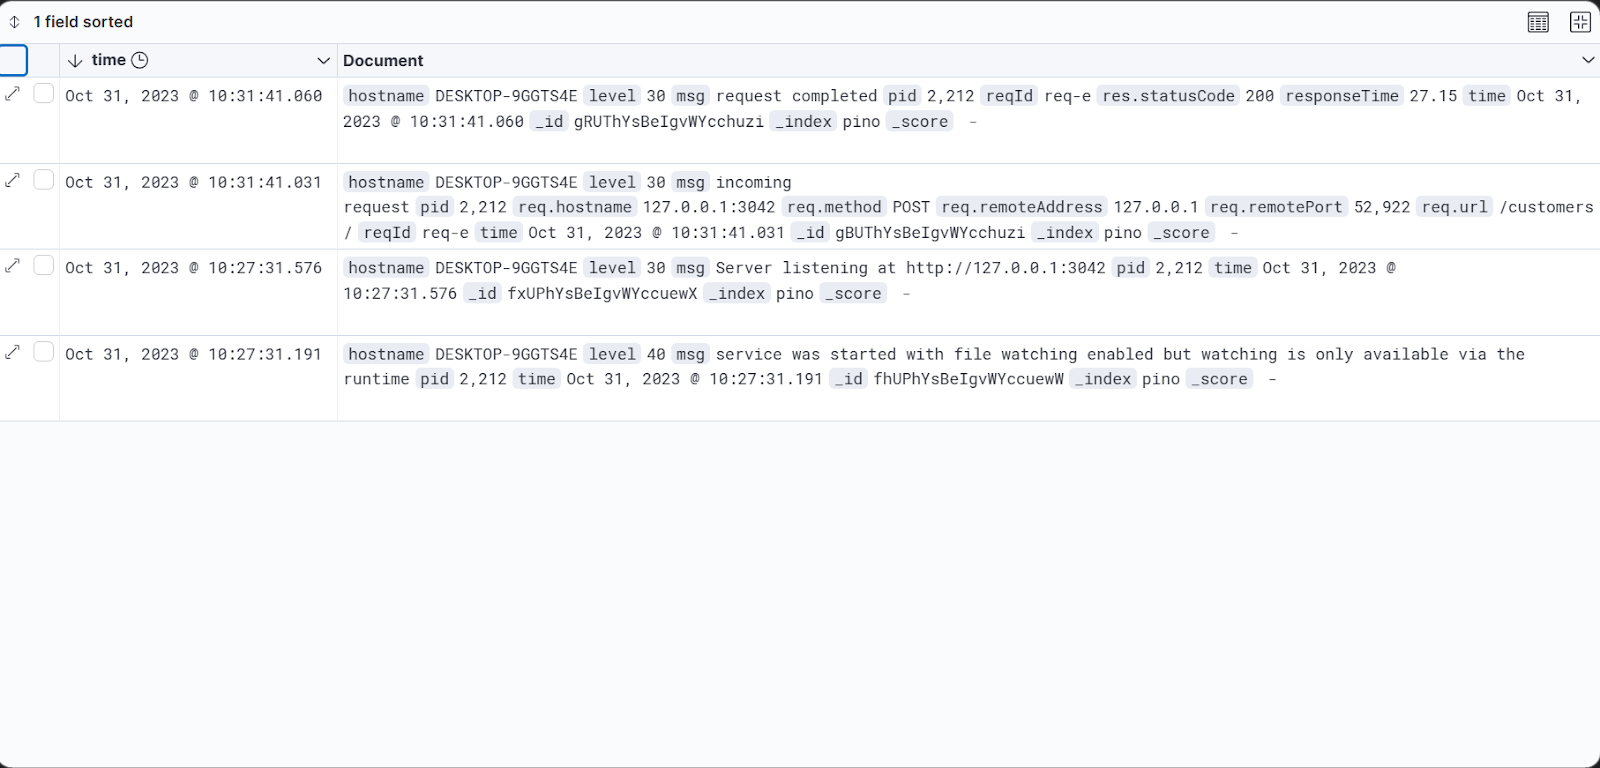
6. You can view your logs
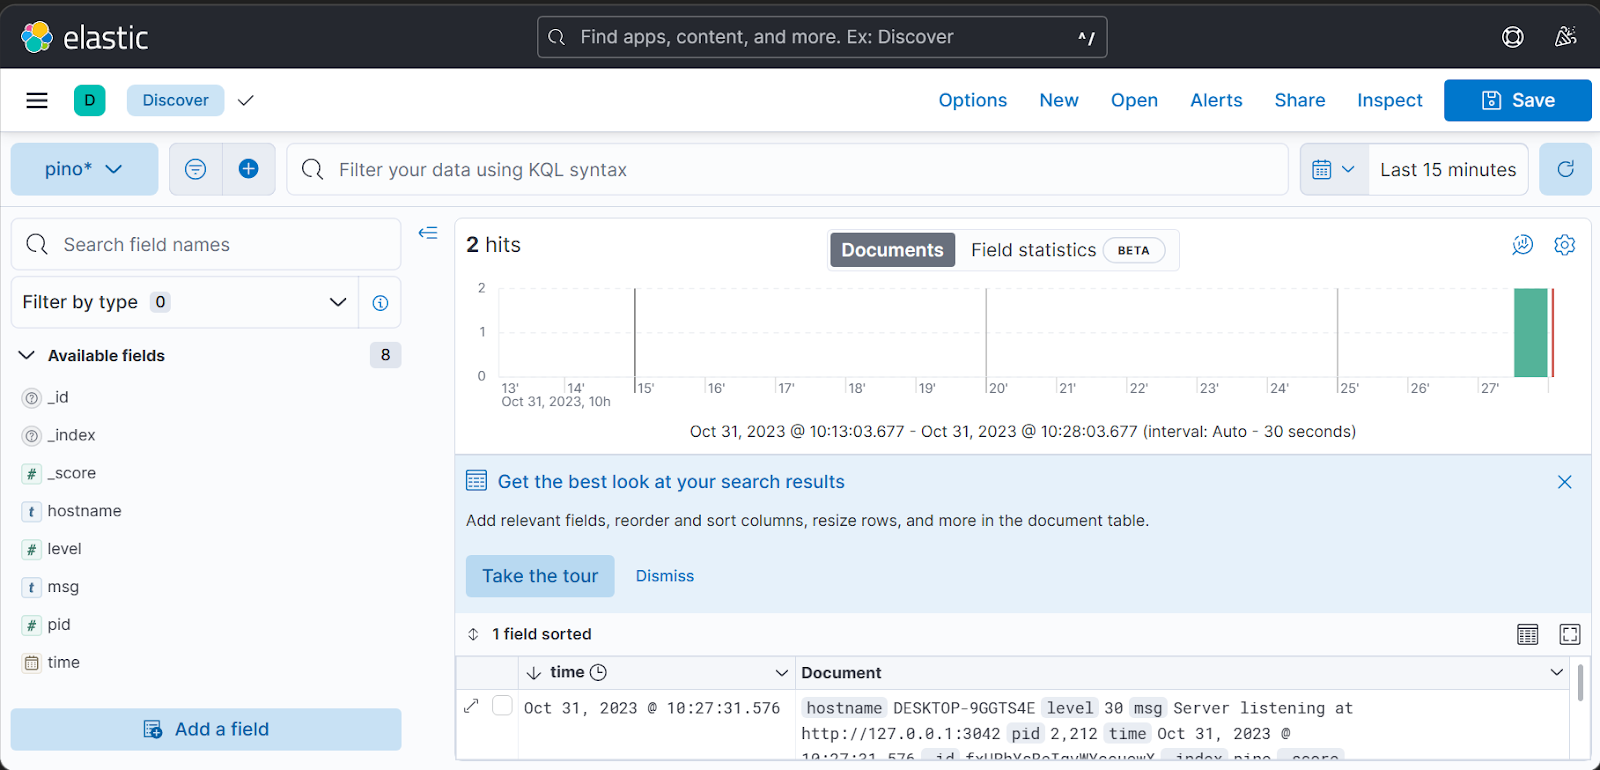
7. You can also set your logs to refresh at a specified interval.
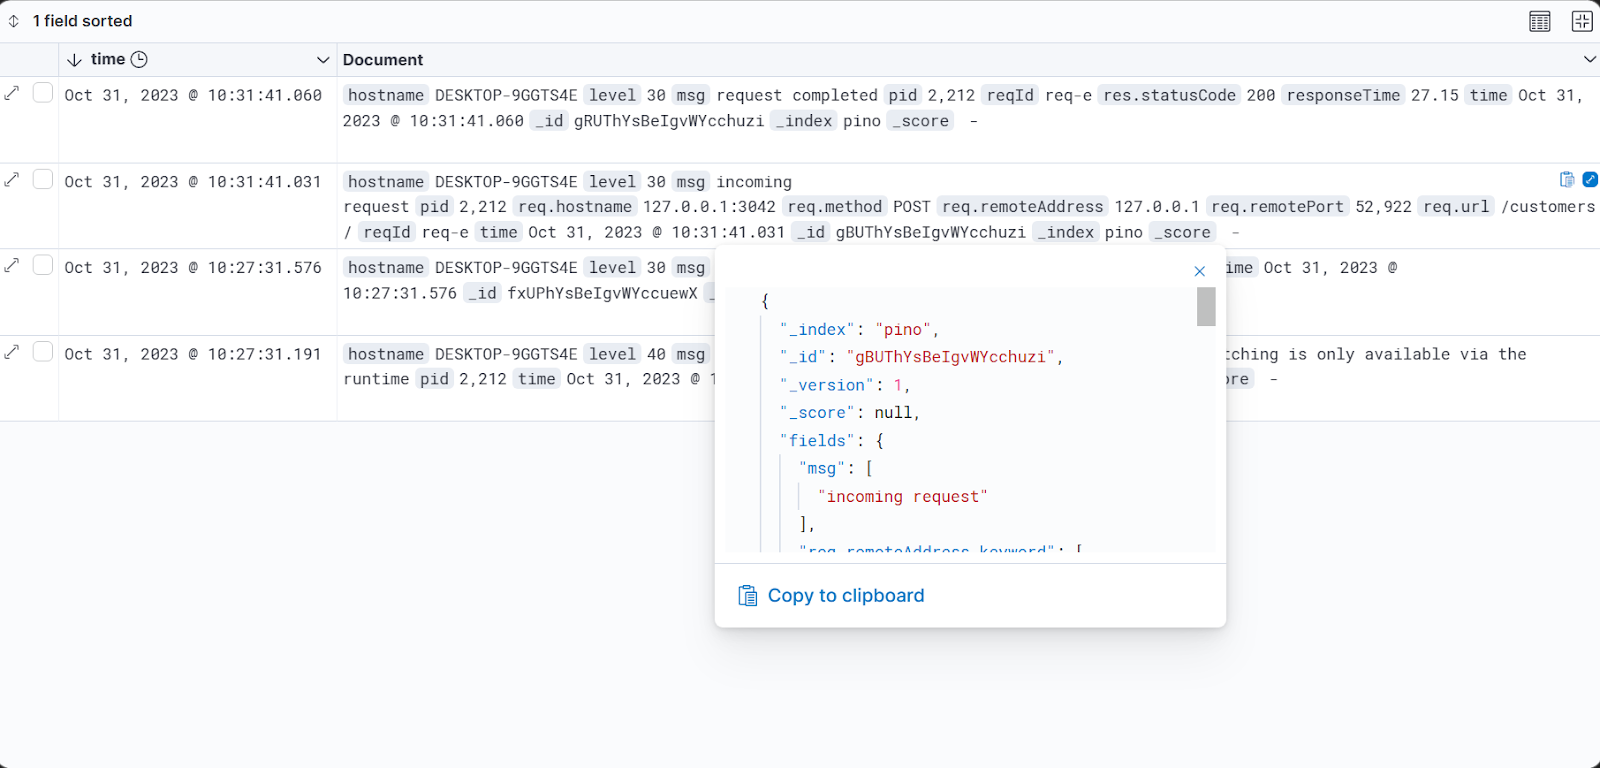
8. You can view your logs in JSON format by hovering on a specific log and clicking on the expand icon on the top right corner of the log.
Wrapping up
In this article, we’ve learned about Pino and why it is a more efficient way of logging. We’ve discussed its main features, configurations and customizations to adapt it to your application’s needs.
You can check out the Pino Official documentation to learn more about its features.