Distributed Tracing with Platformatic and Open Telemetry
In a microservices architecture, a request usually spans between multiple services deployed on different nodes. When this happens, it can be hard to trace issues precisely, particularly when errors happen, or when bottlenecks need to be identified. Tracing can however be done using distributed tracing, which allows for the tracing of calls end-to-end across all the involved systems.
Platformatic uses Open Telemetry (OTEL) to implement distributed tracing. Open Telemetry is an observability framework which is vendor and tool-agnostic and can be used with a broad variety of observability backends, such as Jaeger.
In this article, we will create an example of an API with Platformatic and see how the traces can be collected using Jaeger.
Key Open Telemetry concepts
For our purposes, we will use Open Telemetry for traces (it can also be used for metrics and logs). Open Telemetry backends collect spans, which are generic “units of work”. A span can have a parent (a span with no parent is a “root” span), so the OTEL backends can relate all the spans in a tree representing the distributed trace.
Platformatic Services
In Platformatic, we have different ways of creating and composing services:
Platformatic DB: Services based on Databases
Platformatic Service: Generic JavaScript/TypeScript services
Platformatic Composer: Automatically aggregate multiple service APIs into a single API.
Platformatic Runtime: Run multiple Platformatic microservices as a single monolithic deployment unit.
All Platformatic services are able to create span and propagate tracing, which we will explore below
Setting up
Prerequisites
Ensure you have the following installed on your local machine;
Node.js >= v18.8.0 or >= v19.0.0
A code editor (e.g., Visual Studio Code or Sublime Text)
Docker installed and working
Run Jaeger
This can be done quickly with Docker:
docker run -d --name jaeger \
  -e COLLECTOR_OTLP_ENABLED=true \
  -p 16686:16686 \
  -p 4317:4317 \
  -p 4318:4318 \
  jaegertracing/all-in-one:latest
Check that the server is running by opening http://localhost:16686/ with your browser.
Platformatic Services Setup
We are going to create:
A
moviesDB service exposing the OpenAPI to manage a movies databaseA
countservice which callsmoviesto get the full list of the movies, and then count them (while this wouldn’t be a very useful service in reality, the goal here is to show how distributed tracing works with Platformatic)A
composerwhich aggregates themoviesandcountAPIs into a single API.
movies DB service
Create a movies folder and cd into it:
mkdir movies
cd movies
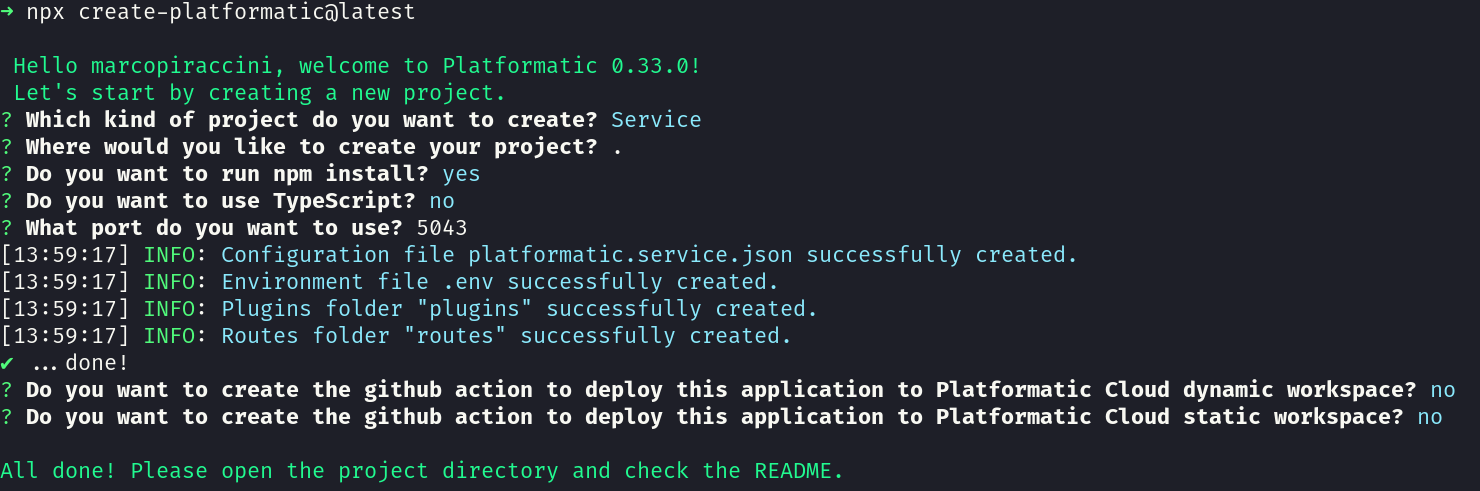
Then, create a db service in the folder using npx create-platformatic@latest. Be sure to set the 5042 port, select sqlite DB and create and apply the default migrations:

Now open platformatic.db.json and add the following:
(...)
  "telemetry": {
    "serviceName": "movies",
    "exporter": {
      "type": "otlp",
      "options": {
        "url": "http://localhost:4318/v1/traces"
      }
    }
  }
You can now start the service with: npx platformatic db start:

count service
In a different folder, create the count directory:
mkdir count
cd count
Then, create a service in the folder using npx create-platformatic@latest. Be sure to set the 5043 port:
Open the platformatic.service.json file and add the following telemetry configuration (this is identical to DB, except for a different serviceName):
(...)
  "telemetry": {
    "serviceName": "count",
    "exporter": {
      "type": "otlp",
      "options": {
        "url": "http://localhost:4318/v1/traces"
      }
    }
  }
We want this service to invoke the movies DB service, so we need to add a client for it:
npx platformatic client http://127.0.0.1:5042 js --name movies
This should be the output:

Check platformatic.service.json to ensure that the client has been added (`PLT_MOVIES_URL` is defined in .env):
(...)
    "clients": [
    {
      "schema": "movies/movies.openapi.json",
      "name": "movies",
      "type": "openapi",
      "url": "{PLT_MOVIES_URL}"
    }
  ]
}
Now open routes/root.js and change the content with the following:
module.exports = async function (fastify, opts) {
  fastify.get('/count-movies', async (request, reply) => {
    const movies = await request.movies.getMovies()
    return { length: movies.length }
  })
}
This code calls movies to get all the movies and returns the length of the array.
Finally, start it with npx platformatic service start:

composer service
Create at the same level of movies and count another folder for composer and cd into it:
mkdir composer
cd composer
Then create the composer on the 5044 port in the folder using npx create-platformatic@latest:

Open platformatic.composer.js and change it to the following:
{
  "$schema": "https://platformatic.dev/schemas/v0.33.1/composer",
  "server": {
    "hostname": "{PLT_SERVER_HOSTNAME}",
    "port": "{PORT}",
    "logger": {
      "level": "{PLT_SERVER_LOGGER_LEVEL}"
    }
  },
  "composer": {
    "services": [
      {
        "id": "count",
        "origin": "http://127.0.0.1:5043",
        "openapi": {
          "url": "/documentation/json"
        }
      },
      {
        "id": "movies",
        "origin": "http://127.0.0.1:5042",
        "openapi": {
          "url": "/documentation/json"
        }
      }
    ],
    "refreshTimeout": 1000
  },
  "watch": true,
  "telemetry": {
    "serviceName": "composer",
    "exporter": {
      "type": "otlp",
      "options": {
        "url": "http://localhost:4318/v1/traces"
      }
    }
  }
}
Note that we just added count and movies as proxied services and added the usual telemetry configuration, with a different serviceName.
Finally, start it with npx platformatic compose start:

Open the OpenAPI definition using this link: http://127.0.0.1:5044/documentation/static/index.html
You should see something like this:

Note that the composer acts as a facade for both the count and movies services
Now, we can populate the movies DB running some POST, e.g.:
curl -X POST -H "Content-Type: application/json" -d '{"title":"The Matrix"}' http://127.0.0.1:5044/movies/
curl -X POST -H "Content-Type: application/json" -d '{"title":"The Matrix Reloaded"}' http://127.0.0.1:5044/movies/

See the traces
Seeing as we want to obtain the “count” of the movies, we will need to call the composer service, which will proxy the count service which in turn will call movies:

We can do the call with any HTTP client, e.g.:
curl http://127.0.0.1:5044/count-movies

Now, open Jaeger with http://localhost:16686/search and select in filter composer as Service and the count-movies operation, then click on “Find Traces”:

You can open the trace by clicking on it:

Note that everytime a request is received or client call is done, a new span is started. As such, we have:
One span for the request received by
composerOne span for the
composerclient call tocountOne span for the request received by
countOne span for the
countclient call tomoviesOne span for the request received
movies
All these spans are linked together, so that you can see the whole trace.
Note that other useful views are available, such as the flamegraph view:

Wrapping up
As we have seen, Platformatic now offers distributed tracing with Open Telemetry out–of-the-box!
To use this feature, you will just need to set up the proper configurations, and then you’ll be able to see all the requests as they are propagated through the microservices.