The Node.js Event Loop
A Deep Dive into Inner Workings and Best Practices
The event loop is core to the performance of Node.js, helping it to perform asynchronous and non-blocking operations by leveraging the kernel. But what can go wrong?
In this article, we demonstrate a way to stall the event loop. Fundamentally, a thorough and accurate understanding of event loops is beneficial for developers to grasp the inner workings of Node.js better and to protect against such a problem.
This article explains the event loop, its importance, and best practices. It also further explains the mathematics behind synchronous response processing and the nitty-gritty of event loop utilization.

How Does an Event Loop Work?
The processor can process multiple requests on a CPU without waiting for other requests. When it comes to the event loop model, it is more performant than the thread-based model because threads cost a lot of memory to execute for the kernel.
Why is the event loop important in Node.js?
The event loop is important in Node.js for several reasons. First, it forms the pillar of Node’s asynchronous architecture, allowing Node to handle multiple concurrent operations without the need for multi-threading efficiently.
Second, the event loop contributes to the performance and resource efficiency of Node.js. The event loop's non-blocking nature allows developers to write code that can be executed on the available system resources, helping it provide fast responses.
Compared to the thread-based model, the event loop model has a significant advantage: it enables the CPU to handle many more requests at once. It is also more performant than the thread-based model, using a lot less memory to execute for the kernel.
The Actual Event Loop
The event loop consists of the following phases:
Timers
Pending callbacks
Idle/prepare
Poll
Check
Close callbacks,
Incoming connections and data

The most important phase is the first phase– the timers. Timers are callbacks registered with ‘setTimeout()’ or ‘setInterval()’.
They also allow us to monitor the event loop with the option to schedule data, ultimately offering a good way to check if an event is idle. The event loop then executes expired timers and checks for pending callbacks again.
The I/O callbacks are checked first in the poll phase, followed by the ‘setImmediate()’ callbacks. Node.js also has a special callback, the process.nextTick(), which executes after each loop phase. This callback has the highest priority.
During the poll phase, the event loop looks for events that have completed their asynchronous tasks and are ready to be processed.
We then move to the check phase, during which the event loop executes all the callbacks registered with ‘setImmediate().
Close callbacks are associated with closing network connections or handling errors during I/O events. The event loop will then look for scheduled timers.
The loop then continues, keeping the application responsive and non-blocking.
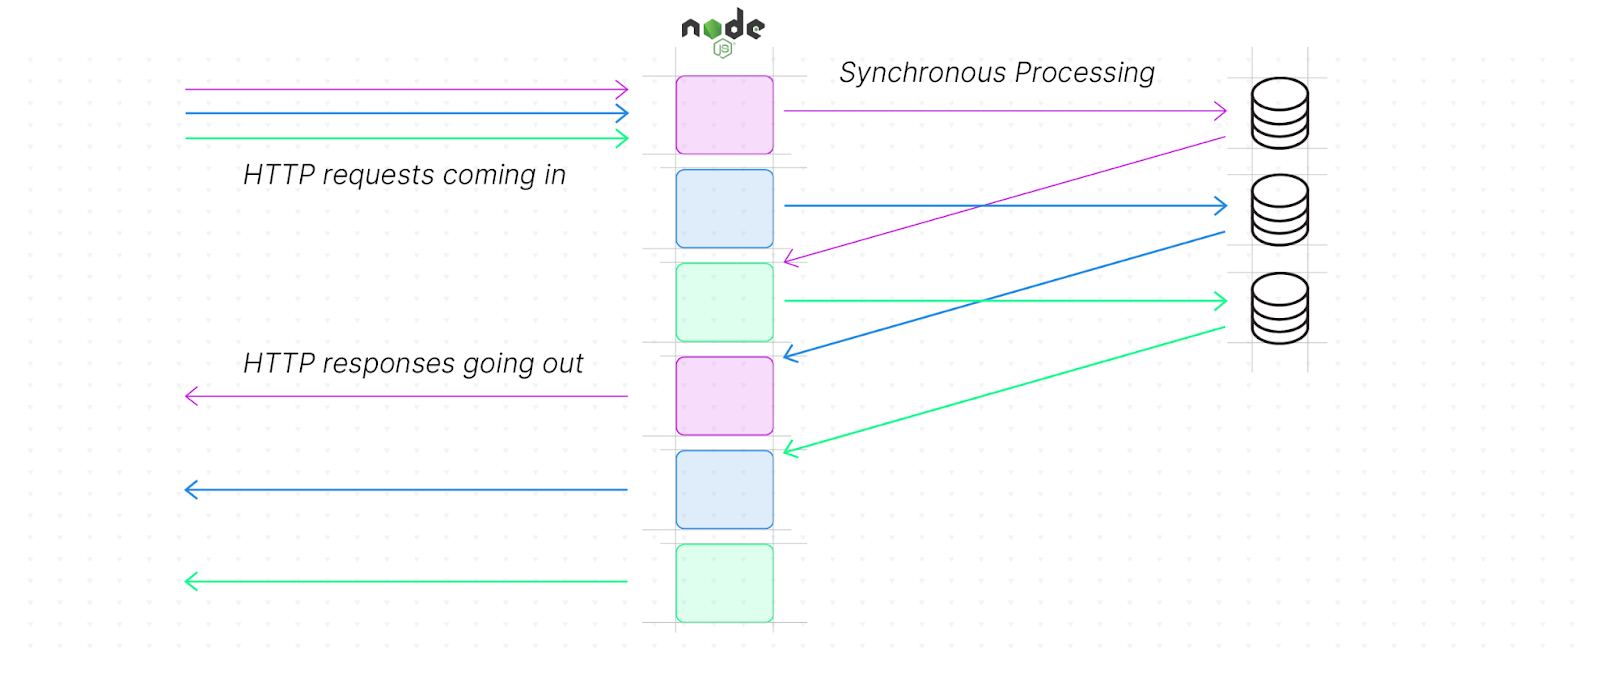
Normal Flow of HTTP Request In Node
When a request comes in Node.js, it is processed synchronously, with the response then undergoing a similar process. However, when a request needs to call the database, it runs asynchronously.
This means that for every request, there are 2 synchronous processes and one asynchronous process. Typically, the response time can be calculated from the formula below:
Response time = 2SP + 1AP
Where SP is Synchronous Processing and AP is Asynchronous Processing.
For instance, if a request takes 10ms of synchronous processing time and 10 ms of asynchronous processing time, the total response time will be:
2(10) + 10 = 30ms.
To calculate the total number of requests serviceable by one CPU can be calculated by:
1000ms/(10ms*2) = 50
The I/O wait is not considered because the event loop runs synchronously.
What Happens When All Requests Arrive At The Same Time?
If, for instance, a server receives three requests at once, how long it will take to process the last request?
The first request is processed while the second and third requests are queued. The second and third requests are then processed in the order they arrived, waiting for the preceding request to finish processing.
The processing time for each of the requests using the standard formula will be 30ms, 50ms and 70ms respectively, with the event loop running synchronously.
To calculate the response time for the last request, irrespective of the number of requests, you can apply the formula:
Response time = SPx\2 +ASx + (SPx-1*2)*
Where x is the number of the request.
When we receive 100 requests, you can calculate how long it will take to receive any of the responses.
A possible solution to reducing this execution time is by scaling your servers based on the CPU usage: however, spawning new servers takes time and it often result in underutilized resources because there can be available capacity in your system despite 100% utilization.
The reason for this is simple: Node.js runs on multiple threads, with a garbage collector and the CPU optimizer running separately. This means that within Node.js, there can be a large amount of free CPU before anything starts to slow down significantly.
The Event Loop Delay
Event loop delays are measurable, meaning that developers can track when an event should fire and when it actually fired.
To get an idea of how this works, you can clone this repo locally and run the code. In this repo, the loopbench.js file contains the following code:
'use strict'

const EE = require('events').EventEmitter

const defaults = {
  limit: 42,
  sampleInterval: 5
}

function loopbench (opts) {
  opts = Object.assign({}, defaults, opts)

  const timer = setInterval(checkLoopDelay, opts.sampleInterval)
  timer.unref()

  const result = new EE()

  result.delay = 0
  result.sampleInterval = opts.sampleInterval
  result.limit = opts.limit
  result.stop = clearInterval.bind(null, timer)

  let last = now()

  return result

  function checkLoopDelay () {
    const toCheck = now()
    const overLimit = result.overLimit
    result.delay = Number(toCheck - last - BigInt(result.sampleInterval))
    last = toCheck

    result.overLimit = result.delay > result.limit

    if (overLimit && !result.overLimit) {
      result.emit('unload')
    } else if (!overLimit && result.overLimit) {
      result.emit('load')
    }
  }

  function now () {
    return process.hrtime.bigint() / 1000000n
  }
}

module.exports = loopbench
The example.js file contains the code below:
'use strict'

const http = require('http')
const server = http.createServer(serve)
const loopbench = require('./')()

loopbench.on('load', function () {
  console.log('max delay reached', loopbench.delay)
})

function sleep (msec) {
  let i = 0
  const start = Date.now()
  while (Date.now() - start < msec) { i++ }
  return i
}

function serve (req, res) {
  console.log('current delay', loopbench.delay)
  console.log('overLimit', loopbench.overLimit)

  if (loopbench.overLimit) {
    res.statusCode = 503 // Service Unavailable
    res.setHeader('Retry-After', 10)
  }

  res.end()
}

server.listen(0, function () {
  const req = http.get(server.address())

  req.on('response', function (res) {
    console.log('got status code', res.statusCode)
    console.log('retry after', res.headers['retry-after'])

    setTimeout(function () {
      console.log('overLimit after load', loopbench.overLimit)
      const req = http.get(server.address())

      req.on('response', function (res) {
        console.log('got status code', res.statusCode)

        loopbench.stop()
        server.close()
      }).end()
    }, parseInt(res.headers['retry-after'], 10))
  }).end()

  setImmediate(function () {
    console.log('delay after active sleeping', loopbench.delay)
  })

  sleep(500)
})
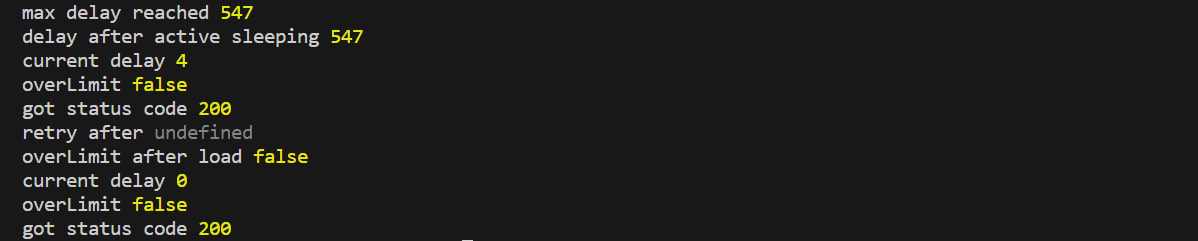
When you run the example.js in the terminal, you will get the output below:
Event Loop Utilization
Event loop utilization (ELU) refers to the cumulative duration of time the event loop has been both idle and active as a high-resolution milliseconds timer. We can use it to know if there is “spare” capacity in the event loop.
ELU is a metric to monitor the amount of time spent in the event loop utilizing the CPU, and can be read straight from libuv- the C library that Node.js uses to implement the event loop.
You can compute ELU using the perf_hooks library. This will return a decimal between 0 and 1, which tells you how much of the event loop was used.
In Fastify, one of the fastest Node.js web frameworks, there is an automatically set-up module called @fastify/under-pressure. You can use it to specify the max event loop delay, the memory and the event loop utilization.
So how does this package work?
When the package receives multiple requests after a certain time, the event utilization goes out of the limit at 0.98s. After this point, any request that comes in gets a response status code of 503.
Imagine having multiple requests, the event loop could have accumulated over 2 seconds of delay. A user might not find it comfortable to wait that long. In this case, you can return a response to let the user know that the server will not return to the request.
So how would this look?
To begin with, clone this repo navigate into the thrashing directory, and find the server.js file which starts the server.
Start the server by running the following command:
node server.js
Then, in another terminal, run the command to emulate 50 connections for 10 seconds to your server:
npm run demo
You will obtain this result in the terminal:
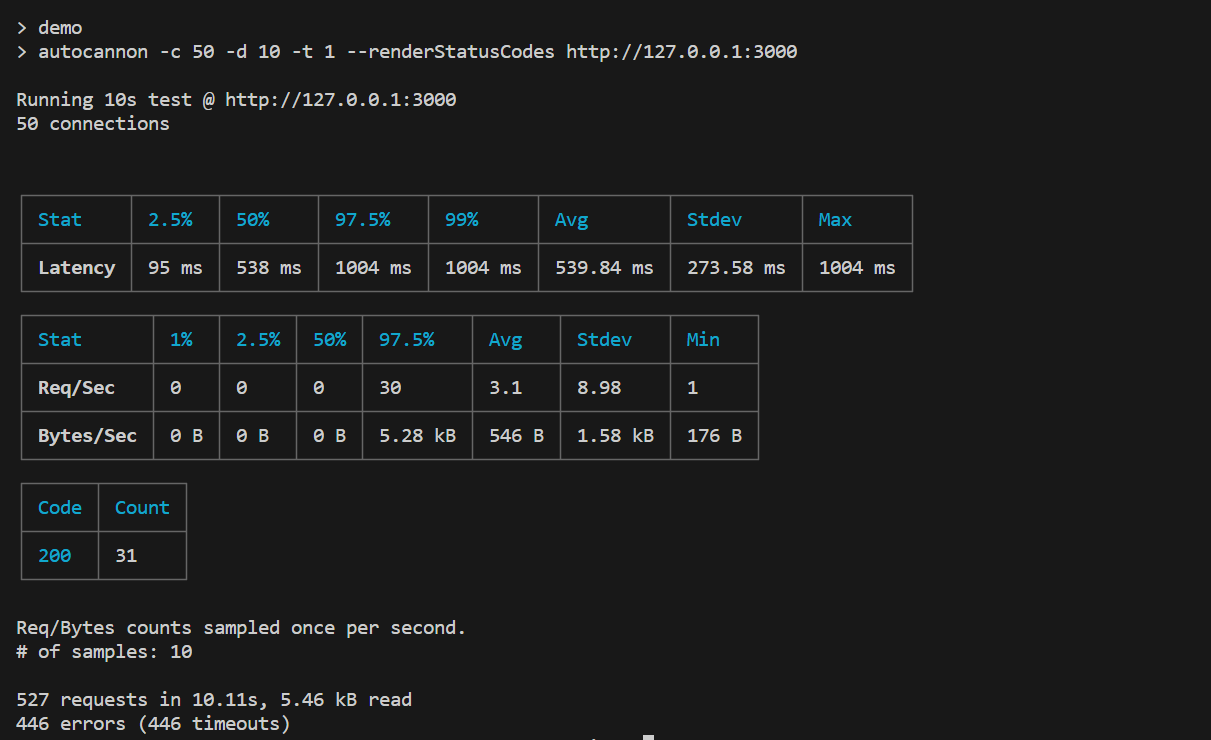
From the output above, the latency is slightly above 1 second and the average request per second is 3 requests.
Let’s now see what @fastify/under-pressure does differently. In the server-protected.js file, the maximum event loop delay is set to 200ms and the event loop utilization to 0.80.
Now start the server using the command below:
node server-protected.js
Then in another terminal, run the command to emulate the 50 connections to your server in 10 seconds. This time, you have a different result as shown below.
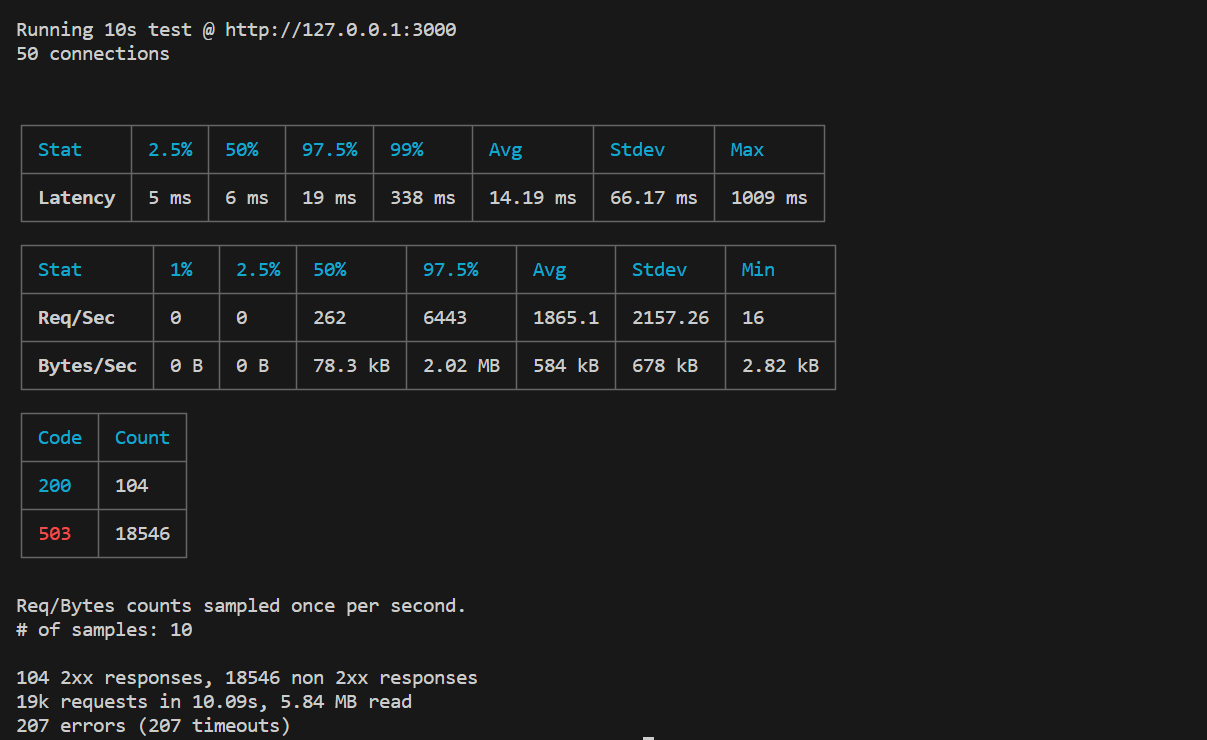
Here we can see that we got a lot more requests– 19k, compared to 527 in the first instance. Here, we got 96 successful requests compared to 31 using the unprotected server.
The function of the under-pressure package is evident by the number of 503 response statuses. The latency is also superior, with 338ms.
The server-load-aware.js file is a slight upgrade because it can even tell if the server is under pressure, offering you more control over what you want your server to do when it is under pressure and when it is not.
When we start our server load and run the demo again, this time we will obtain better numbers.
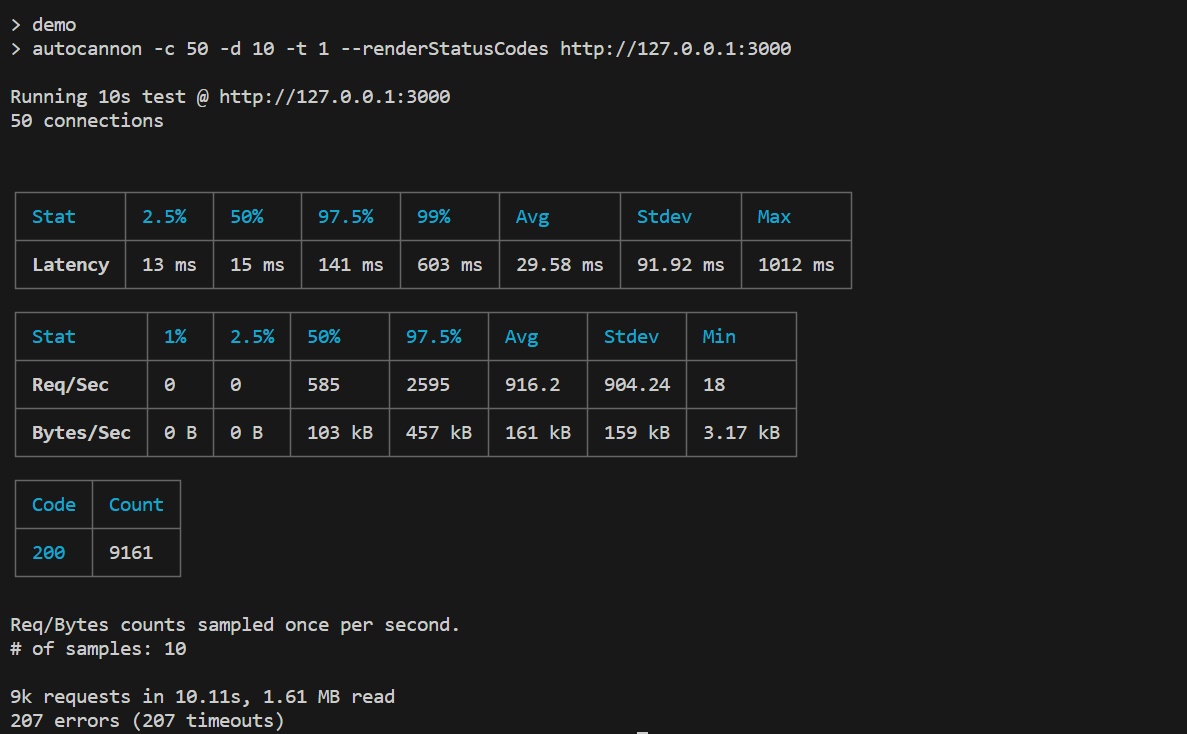
Here, the server can handle more requests per second, compared to the previous two instances. In this case, the 200 response statuses is the highest compared to the other two instances which we looked at. The latency time is also quite low.
The biggest trade-off here is that the server sends cached data rather than returning a 503 response status. In this way, it can handle a lot more traffic and requests.
Best Practice for Event Loops
It is important to always use the event loop efficiently to ensure uninterrupted responsiveness, improved performance, maintainability and scalability.
Do not block the event loop
Move all synchronous processing outside the event loop. Consider moving them to worker threads, which are optimized to do the heavy lifting, namely, taking the strain of synchronous, computationally demanding tasks off the main thread of the Node.js event loop.
This allows your application to maintain its responsiveness and scalability while still performing computationally intensive operations.
You can check out Piscina here. It creates a pool of worker threads, which can process many tasks in parallel.
It also gives you an idea of how many jobs are queuing to be processed, offering users a better view of what is happening within their server.
Consequences of blocking the event loop:
Reduced performance: As the event loop is stalled, the application's ability to handle concurrent requests decreases significantly, impacting response times.
Increased latency: Users experience delays as requests queue up while the event loop is blocked.
Unresponsiveness: In extreme cases, the application may appear to freeze or become unresponsive.
Monitor event loop utilization
Use tools like perf_hooks or the under-pressure plugin to track event loop performance and identify potential bottlenecks.
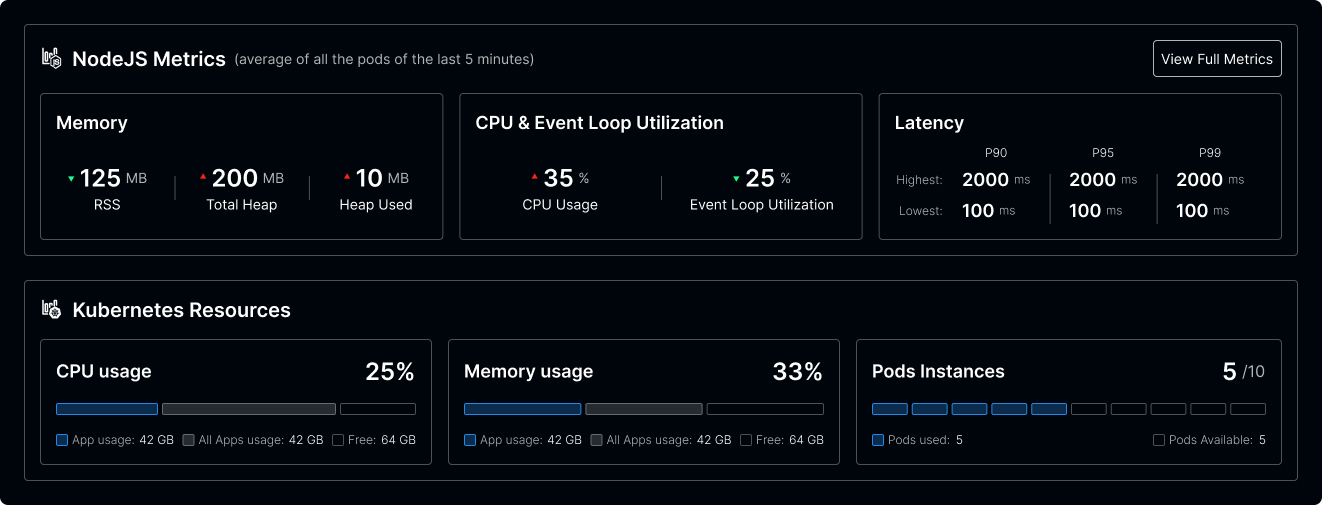
Another tool that can be used is the Platformatic Command Center, which offers a real-time overview of your Node.js applications and services so you can see resource utilization, deployment statuses, and key metrics like event loop utilization, CPU usage, memory consumption, and latency in one place.
Deduplicate Asynchronous Calls
You can make your application faster by reducing the number of overlapping asynchronous tasks. This is where deduplication comes in, which is all about using a single unique data copy and getting rid of redundant data copies, which will still point to the used data copy.
If your application receives three requests for the same data simultaneously, they get deduplicated and only one request goes to the database for processing. We can now respond to all of them through the data that we generated earlier.
This way, your application no longer has to process data for each request as it comes in.
To solve this issue, you can use the async-cache-dedupe package. It is a cache for asynchronous fetching of resources with full duplication, meaning that the same resource will only be served once at any given time.
The API provides options such as ttl, which specifies the maximum time an entry can live. The stale option specifies the time after which the value is served from the cache after it has expired.
It also provides a memory option that defaults to storage and is compatible with Redis. The size of this memory option can also be set.
Note: Platformatic has all these packages integrated into it by default, ensuring your event loop is efficiently utilized.
How to Configure Under-Pressure in Platformatic Service
Fastify powers the under-pressure plugin configuration option, and Platformatic Service uses it to create a health check endpoint.
Configuring the under-pressure plugin involves setting the healthCheck property in the server. Here is a quick guide:
1. Create a new Platformatic Service project by running:
npm create platformatic@latest
You should get this after running the command:
Need to install the following packages:
  create-platformatic@1.10.0
Ok to proceed? (y)
 Hello John Fáwọlé, welcome to Platformatic 1.10.0!
 Platformatic is not supported on Node.js v16.17.0.
 Please use one of the following Node.js versions >= 18.8.0 or >=
20.6.0.
 Let's start by creating a new project.
? Which kind of project do you want to create? Service
? Where would you like to create your project?
platformatic-service
? Do you want to run npm install? yes
? Do you want to use TypeScript? no
? What port do you want to use? 3042
? Do you want to create the github action to deploy this
application to Platformatic Cloud? no
? Do you want to enable PR Previews in your application? no
? Do you want to init the git repository? yes
[17:38:19] INFO: Configuration file platformatic.service.json successfully created.
[17:38:19] INFO: Environment file .env found, appending new environment variables to existing .env file.
[17:38:19] INFO: Plugins folder "plugins" successfully created.
[17:38:19] INFO: Routes folder "routes" successfully created.
[17:38:19] INFO: Test folder "tests" successfully created.
[17:38:23] INFO: Git repository initialized.
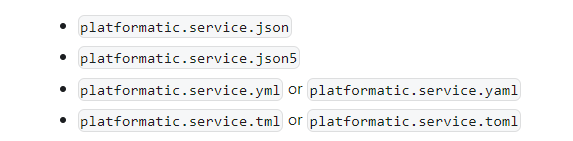
2. Then, go to the server configuration in your Platformatic application. This can be done in the config file, which can be in formats like “JSON", “YAML” or “TOML”. It could contain any of the filenames as seen below.
3. The healthCheck property is what you need to configure to enable the under-pressure plugin. This property can be set to a boolean value or an object.
4. You can set the heathCheck property to an object and specify the interval in milliseconds. For example:
{
  "server": {
    ...
    "healthCheck": {
      "interval": 2000,
      "maxEventLoopDelay": 1000,
      "maxHeapUsedBytes": 100000000,
      "maxRssBytes": 100000000,
      "maxEventLoopUtilization": 0.98
    }
  }
In this example, we set the healthCheck interval is set to 2000 milliseconds or 2 seconds. This means the healthCheck endpoint will be checked every 2 seconds to ensure the service functions correctly.
Here is a GitHub repo to grasp it better.
For more details on configuring the under-pressure plugin and other features, please refer to the Platformatic documentation for clarity.
Wrapping Up
In this article, we have covered the core concepts of the event loop in Nodejs. We also learnt about the event loop utilization, key best practices of the event loop and why it is important to follow these practices in building your application.
Want to talk to us about how the Command Center can help you streamline your Node.js development process? Book a demo.
PS. Having seen how Platformatic works, you can now proceed to migrate your Fastify app to Platformatic Service.